| Quality = Colour | Good = Green | Moderate = Blank | Unhealthy = Yellow | Bad = Red |
|---|---|---|---|---|
| PM2.5 [µg/m3] | 0 ~ 20 | 20 ~ 50 | 50 ~ 90 | > 90 |
| PM10 [µg/m3] | 0 ~ 30 | 30 ~ 75 | 75 ~ 125 | > 125 |
that survey includes info on gas components as available at the stations.
This webpage 'borrows' a dynamic, country-wide prognosis for Air Quality from the RIVM-site to which this Meteo-System indirectly contributes data through the Samenmeten_Dataportaal.
The prognosis can pinpoint a static detailed forecast around a selected Dutch postal code area.

![]()
![]()
24hour graphs
The 24hour graphs summarize the measured data in a running window with periodic, online update, resulting in a general meteo-picture and 2 'dust'-pictures.The interruptions in the graphs for dust and gas generally are the result of modifications and experiments.

- Temperature, Humidity, Rain and Wind are from TFA_Nexus' meteo-sensors.
- Pressure is from the BMP180-sensor connected to Domoticz.

[Therefore not UVI in the graphs of this webpage, but UVX]
Actual Luftdaten-mapdisplay:
click on the 6-cornersymbol for more info
Or actual OpenSenseMap-display
 Several values from the setup show heavy fluctuations.
Filtering in the background reduces noise, peaks and dips.
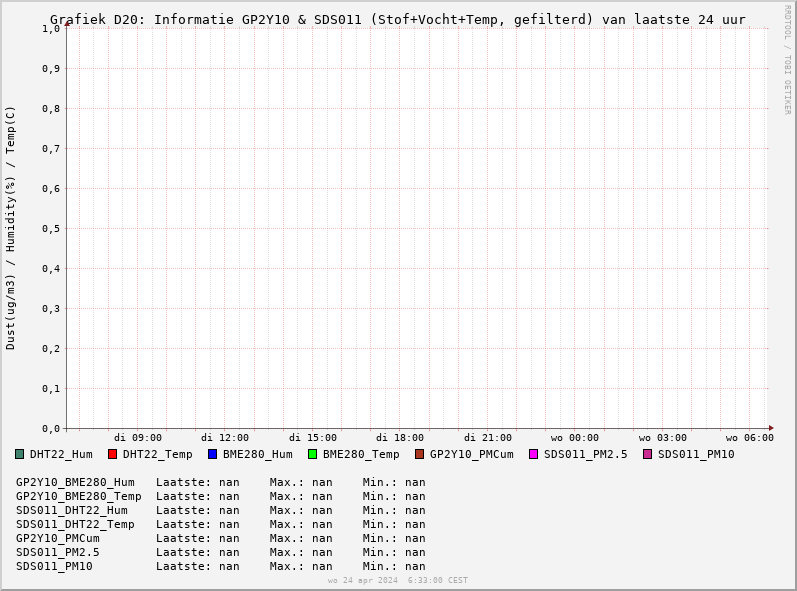
The 'dust' Graph D2 shows the unlimited, filtered values for Dust and filtered values for Humidity:
Graph D20 also comprises the filtered values from the related temperature measurements.
Comments to the graphs on this page:
The components in the 'Dust'-pictures are not always 'single', but 'combined'.
![]()
![]()
Longterm graphs
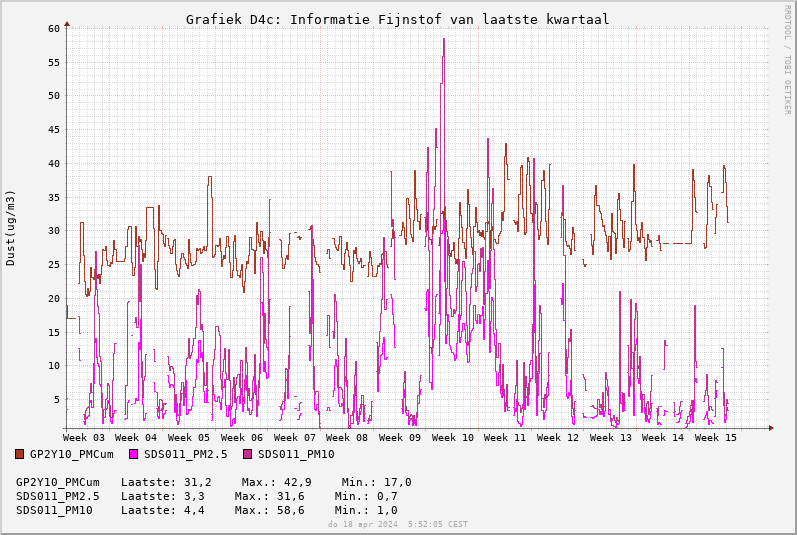
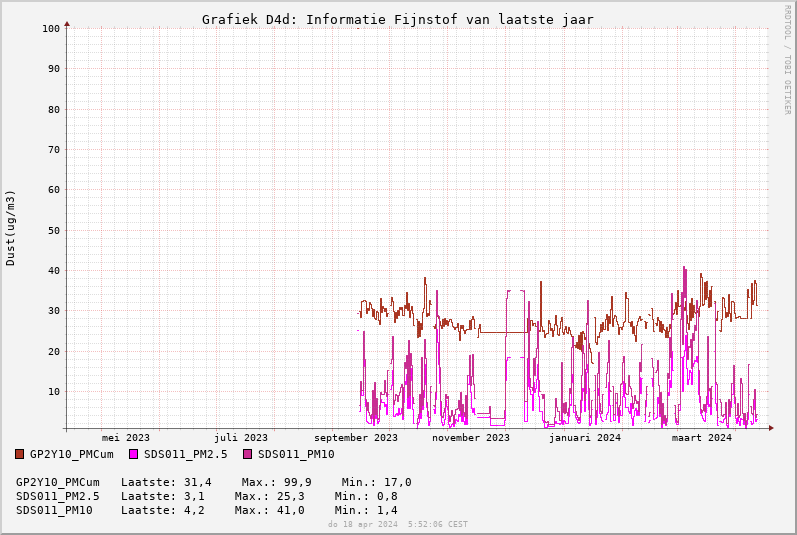
The graphs below provide online information over longer periods than 24 hours.The graphs show average values over a period, which period is different for week-graphs, month-graphs and year-graphs!
That is the reason that you may see different values per graph for Latest, Min. and Max.
The display of Dust values is limited to 100 ug/m3

Milestones for this graph:
Start of measurements: February 01, 2018
Start of measurements outdoor with SDS011&DHT22: March 12, 2018
Start of measurements outdoor with GP2Y10&BME280: March 26, 2018
Alternative pictures:
SDS011-grafieken from Luftdaten.info
BME280-grafieken from Luftdaten.info

Milestones for these graphs:
Start of the graphs:
March 03, 2018
Start measurements outdoor with SDS011: March 12, 2018
Start measurements outdoor with GP2Y10: March 26, 2018

Out for upgrade SDS011&BME280 (DHT22 moved to other segment): December 02~28, 2020
Breakdown&repair SDS011&BME280: May 24, 2021 ~ September 14, 2021
Breakdown&repair SDS011&BME280: March 07, 2022 ~ December 23, 2022
![]() The graphs for past Quarter and past Year may become interesting after the data processing has become stable.
The graphs for past Quarter and past Year may become interesting after the data processing has become stable.
![]()
![]()
Why local measurement of dust?
Air Quality is determined based on the measured values for gasses and for dust, in which dust seems most critical.In the Netherlands the national measuring network provides a global survey & forecast, but (as usual with every meteo-aspect) severe deviations may locally occur.
Because the 'official' measuring sites are at significant distance, that is reason to build a simple, local setup for a measurement for air dust contents as extension of the Meteo-System:
no pretention for high quality & high accuracy, because that requires very different kind of budget .....
Related application of a gas sensor e.g. for NO2 & O3 would be interesting, but the required combination of affordable cost, effectiveness and suitability for DIY-application is not yet available.
![]()
![]()
Setup for measuring Dust-content

the setup is also subject to various other priorities for the available, limited space .......
For the 'local view' on the matter, 2 measuring sets have been fitted at the side of the garage, both at approx. 2.5m~3m from ground, with the 3rd set coming:
- the 'global' set is closest to the street on the wall. Distance to the centre of the street approx. 15m.
The set is a combination of a simple dust-sensor and a Temp&RV&Baro-sensor, for the dust-measurement aiming at a general indication, usable by Domoticz.
Based on a concept described in Let'sControlIt.
Remains 'Experimental' due to the lack of meaningful & stable calibration, in combination with the 'problem' to explain the observations.
- the 'more accurate' set is fitted nearer to the garden, at the bottom of the measuring mast of the Meteo-system.
Distance to the centre of the street is approx. 25m and distance to the wall /edge of the roof is approx. 1m.
This set applies the same configuration of sensors as applied by many other setups participating in Luftdaten.info to assure that an 'honest' comparison of data is possible.
- the 'most accurate' set will be fitted near the 'global' measuring set on the wall.
Distance to the centre of the street is approx. 15m~20m.
Also this set applies a configuration of sensors as applied by many other setups participating in Luftdaten.info to assure that an 'honest' comparison of data is possible.
The 'global' set with sensor type GP2Y10 provides a 'general' measurement of the dust content.


![]()
![]()
![]()
![]()
![]()
The setup with GP2Y10 and BME280 has the layout described below.
- All components are enclosed in a protecting, metal housing (= siren-cabinet of alarm-system)
- A small fan at the back of the housing sucks the air through the GP2Y10-sensor and blows the air behind the housing, causing underpressure in the housing
- Outside air will flow in through the gazed openings of the housing at sides and at the front
- The BME280 sensor sits in the lower half of the housing
- Processing & control by ESP8266/WEMOS-processor with ESPEasy
- Communication over WiFi to the Domoticz-controller, for which an antenna is fitted at the outside of the housing
- The WEMOS-compatible Powershield simplifies power supply over relatively long cable, because 'raw' 7VDC~24VDC goes to the housing, with clean-up in the housing.
The fan is directly connected to the output of this secondary power supply, to assure a constant/stable speed control for the fan.
- Fit heating 1. in the bottom of the housing, or 2. in the airflow to the sensors GP2Y10 and MiCS6814
Argument = Suppression of effects of moisture
1. Improve the climate for the electronics
2. Improve the quality of measurement of dust and gasses
[If 2. is applied, it is mandatory that the BME280-sensor is in the same flow.
To be reported at the website that/how drying is applicable, otherwise confusing for the observer because of the 'strange' T&H]


The setup for SDS011 and BME280&DHT22 has the following layout:
- All sensors are enclosed in a protecting, plastic housing:
- 100mm fan-exhaust, with upper windows covered by gaze, and
with extra, white-painted skirts to protect against influence of sun & rain - sun-controlled fan in top of the housing
Argument = less effects of temperature from the sides of the housing + amplified drying of interior components by controlled airflow - Components SDS011 and NMCU enclosed in extra boxes as environmental protection
- Bottom closed by a transition-element 100/80mm with gazed disc on top of the 80mm-opening
- The interface-cable and the tube for sucking air to the SDS011-sensor run down through the gazed disc
- The tube as frontend has a filter-capsule in which the BME280 & heating
Argument = 'improve' air quality for measurement, and measure upfront - Other air flows in at the bottom and all air 'naturally' exits at the top-windows
- The fan of the SDS011 sucks air through the SDS011 dust-sensor
- The DHT22-sensor (as general T&H-monitor) sits in the top of the housing, just above the electronics, separately controlled by an ESP8266
[Earlier the DHT22 was at the bottom of the housing to measure the incoming air, but at that position too subject to moisture.
Therefore, and related to better quality, replaced by the BME280-sensor.] - Processing & control by ESP8266/NMCU-processor
- Communication over WiFi to the mapserver at Luftdaten.info (= indirect to RIVM and OpenSenseMap) and to the local Domoticz-controller
- Power supply over the USB-interface cable for circuits + SDS011-fan.
- Power supply for ESP8266 & heating is separate
- Fit & connect heating in the airflow to the SDS011-sensor
Argument = Suppression of the effects of moisture
1. Improve the climate for the electronics
2. Improve the quality of measurement of dust
[If heating is applied, it is mandatory that the BME280-sensor is in the same flow and that T&H of that BME280 is reported to Luftdaten and subsequently to RIVM, because any corrective calculations must apply the really related T&H of the air flow.
Before application of heating, to be determined how this reporting is realised.
To be reported at the related websites that/how drying is applicable, otherwise confusing for the observer/application because of the 'strange' T&H, different from 'normal' outdoor temperature.]
Back to the webpage for / Terug naar de websectie voor Meteo
De websectie voor Experimenten begint hier
Sitemap/ Jumplist voor deze website, incl. links to english versions of pages

Copyright © 2013-2022 T4S
Samenvatting voor Rechten & Verantwoordelijkheden / Summary for Rights & Liabilities